Are Leicester City sustainable Champions in a way the Blackburn Rovers never were?

Introduction

With Leicester City on the verge of winning the Premier League title, a lot has been made about their title run this year. The New York Times recently revered Leicester’s title campaign as “Soccer’s Most Remarkable Season” (see link here). The Guardian recently called Leicester’s campaign the “Greatest Underdog Story Ever Told” (see link here). 
 
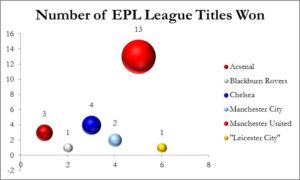
In the modern era of the Premier League, since 1992 there have only been 5 teams to win the league[1]:


  • Arsenal (3x champion): 1997-98, 2001-02, 2003-04
  • Blackburn Rovers(1x champion): 1994-95
  • Chelsea (4x champion): 2004-05, 2005-06, 2009-10, 2014-15
  • Manchester City (2x champion):  2011-12, 2013-14
  •  Manchester United (13x champion): 1992-93, 1993-94, 1995-96, 1996-97, 1998-99, 1999-00, 2000-01, 2002-03, 2006-07, 2007-08, 2008-09, 2010-11, 2012-13
  • “Leicester City” (1x champion): 2015-16 (pending)
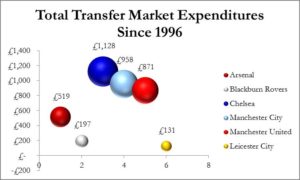
The past 20 years, The Big Four of Arsenal, Chelsea, Manchester City, and Manchester United have spent a combined £3.48 billion in the transfer markets which has led to one of the Big Four winning 96% of the Premier League titles (22 of the 23) since 1996[2].


Looking to the future, as Leicester City stands on the brink of breaking this dominance and making Premier League history much in the same manner that Blackburn Rovers did in 1994-95, the question remains can they sustain their excellence much in a way that Blackburn Rovers was unable to do?
 

What Happens Next? A Mass Exodus of Players?

There is simply no question that Leicester City’s success this year has been remarkable and as a fan of sports I have to admit that I found myself rooting hard for them each week. But a direct result of this success has been a significant increase in the valuations of most of their players. And this increase in valuation leads to increased interest from the Big Four clubs.
 
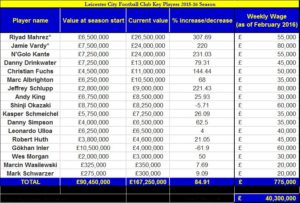
This season alone, Leciester City’s core group’s value (as shown below) has risen an estimated 84.9% this year[3]:


After Blackburn Rovers won the league there was a mass exodus of players, and their results began to slip. Four years later, Blackburn Rovers were relegated from the Premier League to Division One in the 1998-99 campaign. In a similar vein to Leicester City, Blackburn Rovers saw their player valuations skyrocket, and they were unable to avoid being pulled part by the bigger clubs who could afford to repeatedly break transfer and wage records to lure star players away. And based on recent reports regarding N’Golo Kante (see here) the summer exodus may be on its way…
 

Champions of England = More Money for Key Players… But Will it Be Enough?

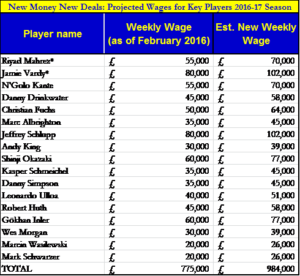
By winning the Premier League, Leicester City stand to pocket roughly £90.6 million which is +27% more than they pocketed last year for their 14thplace finish (£71.6 million)[4]. Given this windfall, there would be room for Leicester City to comfortably increase their annual wage bill on their Key Players from £40.3 million to £51.2 million.
 
The following key players’ new wages would look something like this (assuming everyone got their equal share):


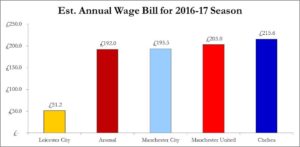
But even at these elevated levels, the weekly wages are far less than the wages being paid at the Big Four. Specifically, this coming year alone, Chelsea, Manchester United, Manchester City, and Arsenal will have estimated annual wage bills of £216, £203, £194, £192 million respectively. 


On average, the Big Four have the ability to pay anywhere from 3.8x to 4.2x what Leicester City can pay. Given this, the Big Four could easily pay someone like Jamie Vardy, N’Golo Kante , or Riyard Mahrez £140,000 per week. Shit, Chelsea currently pays Diego Costa and Eden Hazard £185,000 and £200,000 per week to come in 10th.
 
Even though Leicester City will be playing in Champions League next season, I don’t believe it will be enough to keep their squad intact. For players like Jamie Vardy, N’Golo Kante, and Riyard Mahrez, they will be able to more than double their weekly wages at any of the Big Four clubs (if their intent is to stay in England). Money talks far more than Tuesday night’s in the Champions League.
 
So while I don’t predict the same massive exodus of all of players that occurred at Blackburn Rovers after the 1994-95 season, Leicester City will see some turnover in key positions for which, they will be highly compensated (I estimate that the transfers of Vardy, Kante, and Mahrez will easily net Leicester City £85.7 to £104.3 million).
 

But Leicester City is Different to Blackburn Rovers in One Key Way?

Given the significant valuation increases and the lack of weekly wages compared to the Big Four clubs for their key players, it seems on paper that Leicester City will struggle to keep their key players much in a similar fashion to Blackburn Rovers.  But Leicester City is different to Blackburn Rovers in one key way: The Foxes have a Thai billionaire owner
 
 
In 2010, Leicester City was bought for £39 million by Vichai Srivaddhanaprabha, a Thai billionaire owner:


For those of you that have watched Leicester City this year, you may or may not have seen his helicopter on the pitch at King Power Stadium at the end of each match:


But more importantly than his fashionable helicopter, Vichai Srivaddhanaprabha has BIG ambitions for Leicester City even before this season. He declared after the 2013-14 season, he would willingly spend £180 million to break into the top 5 in the next three years, and since he bought the club, Leicester City have spent roughly £77 million on transfers. To put this in some perspective, since 1996 Leicester City have spent a grand total of £131 million on transfers.
 
So unlike Blackburn Rovers, Leicester City has a very rich owner that is on par with some of the bigger clubs. And when all is said and done, Vichai Srivaddhanaprabha will willingly dig into his deep pockets in an attempt to build upon the success of the 2015-16 campaign. With an estimated net worth of $2.9 billion[5]Khun Vichai, as he is often called, will be the reason Leicester City don’t disappear in the similar fashion that Blackburn Rovers did many decades ago.
 
Enjoy the Leicester City miracle for what it truly is… an underdog story but be prepared… The Foxes aren’t disappearing anytime soon.


[1]TOTALSPORTEK2. “List of English Premier League Winners Since 1992.” 15 Aug. 2015. Web Retrieved 30 Apr. 2016

[2] http://www.transfermarkt.co.uk/

[3] THE MIRROR. “Football Manager reveals staggering amount Leicester City’s title chasers’ value has rocketed this year.” 18 Feb. 2016. Web Retrieved 30 Apr. 2016
[4] TOTAL SPORTEK. “(Predicted) Premier League Prize Money Table 2016 Season.” 16 Apr. 2016. Web Retrieved 30 Apr. 2016
[5] http://www.forbes.com/profile/vichai-srivaddhanaprabha/
 

Chelsea F.C. need a new stadium as Roman Abramovich thinks long-term

Introduction

With all of the turmoil surrounding Chelsea F.C. due to the 2nd sacking of Jose Mourinho, and given the uncertainty regarding the future direction of this club, I wanted to take a serious look at the long-term financial sustainability of Chelsea F.C. The recent 2016 Deloitte Football Money League rankings have placed Chelsea F.C. 8th overall at an estimated £323 million in revenue for the 2014-15 season[1]. This position is down 1 spot from last year’s ranking of 7th and down 4 spots from their highest all-time ranking of 4th in the 2006-07 season.
 
Since Roman Abramovich took control of Chelsea F.C. in 2003, the Blues have seen their annual revenue grow from £110 million in 2003 to £314 million for the 2014-15, a compound annual growth rate of approximately +8.42%. But during this 13 year period, the Blues have only posted positive operating profits twice (in 2011-12 the year the won Champions League and 2013-14). In fact, the average operating loss during this 12 year period (including the 2 years of profit) is approximately -£57 million. Despite winning the Barclays Premier League and the Capital One Cup last year, Chelsea F.C. racked up a £23.1 million loss[2].


With Chelsea almost certain to miss next year’s Champions League (barring some dramatic/fantastic change in form), the Blues are in some jeopardy of slipping into financial uncertainty given their heavy reliance on non-controllable sources of income. The average financial hit to broadcasting revenue for failing to qualify for Champions League football has been estimated to be £35 million[3]. Furthermore, this lack of Champions League football will put a barrier on their ability to retain their top talent this summer, almost certainly forcing Chelsea F.C. to overhaul their player roster.
 
The easy answer is to simply just blame Chelsea F.C.’s forever growing wage bill with has grown at a compound annual rate of +10.9%[4]. But as you will see from this write up, there is far more to this story than simply reducing player wage bills. It is my opinion that the primary way for Chelsea F.C. to reduce its reliance on Champions League and to secure their long-term financial position is to invest in a larger stadium.
 

Revenue Sources for a European Football Club

The single most important measure of whether or not a football club has a puncher’s chance at financial sustainability is their ability to generate revenue from multiple sources. Traditionally, football clubs rely upon the following sources of revenues:
 
1.       Match day revenue including tickets and corporate hospitality sales
2.       Broadcast rights including distributions from participation in domestic leagues, cups, and European club competitions
3.       Other commercial sources including sponsorships, merchandising, stadium tours, and other commercial operations
 
In the current world of European football, revenue sources have drastically changed over the last ten years with a majority of revenue coming from non-match day sources. This year’s Deloitte Football Money League report marks the lowest ratio of total revenue that has been comprised by match day revenue. The split between the three principle revenues sources for the majority of European football clubs is as follows[5]:
 
    • Match day generates 19% of total revenue
    • Broadcast rights generate 40% of total revenue
    • Other commercial sources generate 41% of total revenue.
In contrast for Chelsea F.C., since the 2009-10 season, the Blues have driven 27% of their revenue from match day, 41% from broadcast rights, and 32% from other commercial sources[6]. Different to some of the other elite European football clubs, Chelsea F.C. is far more reliant upon match day revenue. With such a large sum of their revenue driven by match day, it is critical that Chelsea start actively planning for the long term and focus on the single most controllable and important source of income to the club: match day revenue.
 

Current Chelsea F.C. Match Day Revenue

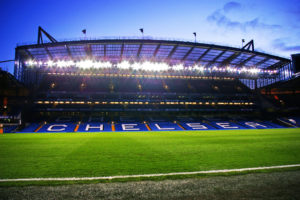
Chelsea F.C. currently plays its home matches at Stamford Bridge which has a max capacity of 41,798 and in the current season, the Blues average attendance is 41,516[7]. Opened in 1877, max capacity at Stamford Bridge ranks 8th overall in the Barclay’s Premiere League while average attendance ranks 7th.
 
 
When you compare Stamford Bridge to Chelsea’s closet financial rivals, United, City, and Arsenal all have stadiums that are much larger than the Blues’:
 
    •  Manchester United’s average attendance at Old Trafford is 75,345 with a max capacity of 75,635. United’s home ground is 1.82 times larger than Stamford Bridge
    • Arsenal’s average attendance at Emirates Stadium is 59,951 with a max capacity of 60,260. Arsenal’s home ground is 1.45 times larger than Stamford Bridge
    • Manchester City’s average attendance at Etihad Stadium is 53,897 with a max capacity of 55,097. City’s home ground is 1.33 times larger than Stamford Bridge
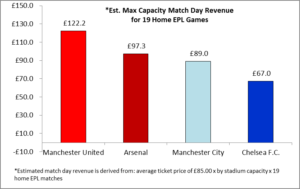
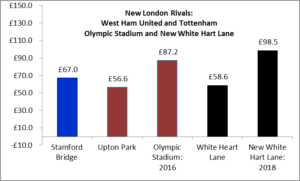
With Chelsea’s current size limitations, at an average price of £85 per ticket, Chelsea F.C. is making roughly £3.5 million per home game and roughly £67.0 million annually for 19 home premier league matches. 


Compared to its closet financial rivals, Chelsea F.C. makes £2.9 million less than United, £1.6 million less than Arsenal and £1.2 million less than City per home game. Given this discrepancy in home ground revenue, Chelsea F.C. is missing out on approximately £22 million to £30 million in match day revenue annually. 
 
An absolute key component to Chelsea’s long-term financial stability will be to increase match day revenue on part with Arsenal and the two teams from Manchester.
 
 
A Minimum 60,000+ Capacity New Stadium is a Must
As I mentioned before, the average cost of missing out on Champions League football is £35 million, and this year’s performance by Leicester City and Tottenham shows that guaranteed top four finishes are no longer the norm for Chelsea F.C (just ask Liverpool F.C). Although this season might be a “one-time” aberration, it is absolutely vital for Chelsea F.C. to develop a bigger home ground to solidify and secure the future success of this football club.
 
When you look to the east of London and the north of London, you see two clubs in West Ham United F.C. and Tottenham Hotspurs F.C. who fundamentally have taken serious strides to do as much. Both the Hammers and the Spurs have long-term established plans to increase their stadium capacities from the mid-35,000 range. West Ham will be moving to the 54,000 seat Olympic Stadium for the 2016-17 season, while Tottenham will build a 61,000 capacity stadium to replace their current home ground for the 2018-19 season. 


*West Ham United’s new 54,000 capacity home ground for the 2016-17 season. Their current home ground of Upton Park only holds 35,016[8]

*New White Hart Lane will cost £750 million and will seat well over 61,000 fans starting in 2018. Current White Hart Lane only seats 36,284[9]

Both of these aggressive moves will put West Ham United and Tottenham Hotspurs F.C. in a far more advantageous and financial stable position than the Blues:
 
 
I estimate that West Ham match day revenue will grow by +54% to £87 million while Tottenham match day revenue will grow by +68% to almost £100 million annually. It’s a no-brainier whatsoever that Roman Abramovich needs to double down on his belief in Chelsea F.C. and build the club a new stadium. But it wouldn’t be Chelsea F.C. if there wasn’t some wrinkle to this story…
 

What Is Preventing Chelsea F.C. from Building the 60,000+ Stadium of their Dreams?

In the 1970’s and 1980’s Chelsea F.C. suffered serious financial setbacks following a large scale attempt to renovate Stamford Bridge. In order to keep the club afloat, Stamford Bridge freehold (rights of ownership to the property) was sold to a property developer by the name of Marler Estates. In doing do, Chelsea F.C. ceded control of their own home ground.
 
This arrangement continued through the early 90’s until a group of Chelsea F.C. lifelong supporters founded the Chelsea Pitch Owners (CPO) and purchased the Stamford Bridge freehold, the pitch, and the Chelsea F.C. name. This move was made to ensure that Stamford Bridge could never again be sold to property developers not related to the club. At the same time though, it also ensured that any talk of a new stadium had to be passed by 75% of the members of the CPO.
 
***A quick aside… Guess who is the president of the Chelsea Pitch Owners? The one and only captain John George Terry***
 
This unique relationship between Chelsea F.C. and the CPO has put the club in a very tough position. They know that it is a must to increase the capacity of their home stadium, but the CPO have forced Chelsea F.C. to play their home games at Stamford Bridge or lose the right to use the Chelsea F.C. name (since the CPO own the rights to the name as well). So if you are forced to stay in your correct location but you know that you have to increase stadium capacity, what are you going to do Roman Abramovich?
 

Expand Stamford Bridge to 60,000+ and Move to Wembley Stadium in the short-term

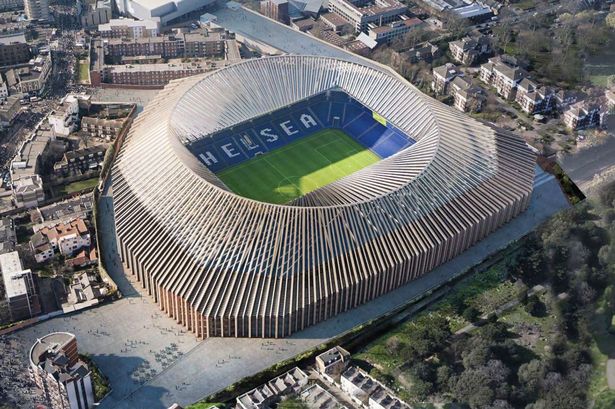
Currently, Chelsea F.C. is in the planning and development stage of a 60,000+ expansion to their current home ground Stamford Bridge with the estimated cost of the project currently valued at £500 million[10]. During the three year period of construction starting in 2017, the Blues are planning to play their home games at Wembley Stadium which is a mere 10.6 miles from Stamford Bridge. Home matches at Wembley stadium will be restricted to 50,000 even though max capacity is 90,000, and the total annual cost to the Blues for rental of Wembley will be £20 million. The photo below is the current development design for the New Stamford Bridge by Swiss architects Herzog & de Meuron:
 

I have created a financial projection of this construction project and without question, this is absolute the right thing for the football club to invest in:


It still remains to be seen if this major redevelopment project will pass the major planning and economic obstacles that currently exist. But one thing is remarkably clear for Chelsea F.C…. In this day of rising Premiere League broadcast money and new upstart clubs like Leicester City, sustained match day revenue growth will have to be the primary means by which Chelsea F.C. ensures its financial future. With West Ham and Tottenham breathing down their necks, Chelsea’s current financial superiority is under pressure and a new stadium will go a long way to relieve some of this pressure.


[1]SPORTS BUSINESS GROUP. “Top of the table: Football Money League” Deloitte 1 Jan. 2016. Web Retrieved 1 Feb. 2016.

[2]Chelsea FC. “Financial results announced with FFP compliance maintained.” Chelsea FC Website. 23 Nov. 2015. Web Retrieved 2 Dec. 2015.
[3] KEEGAN, MIKE. “The cost of failing to qualify for the Champions League.” MailOnline. 17 Sept. 2015. Web Retrived 13 Feb. 2016.
[4] ZIEGLER, MARTYN. “Chelsea player wage bill the highest in the Premier League last season at £215.6m” Press Association. 8 Jan. 2016. Web Retrieved 1 Feb. 2016.
[5] SPORTS BUSINESS GROUP. “Top of the table: Football Money League” Deloitte 1 Jan. 2016. Web Retrieved 1 Feb. 2016.
[6] O’REILLY, LARA. “Samsung to Pull Chelsea FC Sponsorship: Turkish Airlines To Take Over With Larger Package.” Business Insider. 6 Oct. 2014. Web Retrieved 1 Feb. 2016
[7] SoccerSTATS.com. “Premiere League Home Attendance for 2015/16 Season.” Web Retrieved 9 Feb. 2016

[8] http://www.whufc.com/New-Stadium/Activities

[9] http://www.tottenhamhotspur.com/news/northumberland-development-project-updated-designs-and-plans-080715/

[10] DUBAS-FISHER, DAVID. “Chelsea Stamford Bridge expansion plans: Why £500 million is good value for Roman Abramovich.” 2 Jul. 2015. Web Retrieved 13 Feb 2016.

A $7.3 billion investment by ESPN in college football ensures another decade of FORCED cable subscriptions for sports TV

Introduction

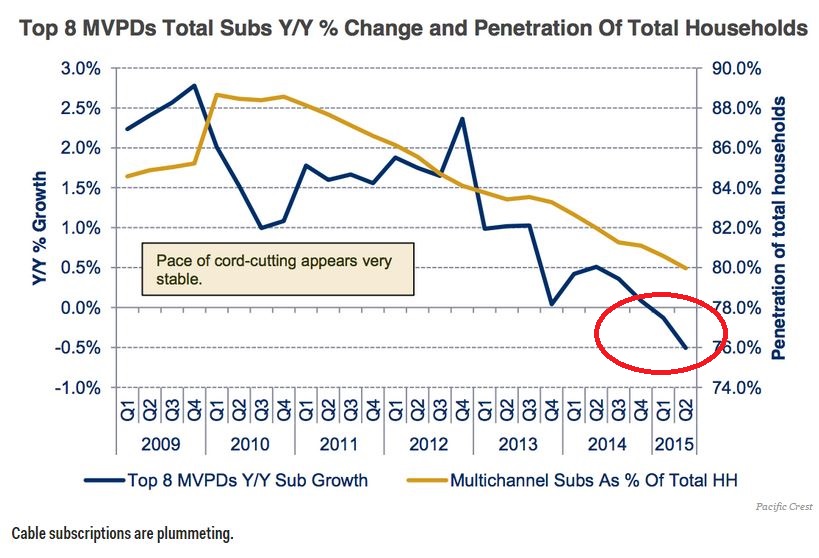
For the last five years, the percentage of households with cable subscriptions has been falling, and while cable television providers have known this, year-over-year growth has still been marginally positive. That was until 2015! For the first time in the history of cable subscriptions, year-over-year growth for the first half of 2015 trended negative[1].


The fact is traditional television viewing is unraveling, and big media conglomerates and their broadcast partners aren’t reacting quickly enough to changing consumer habits. 
 
 
Thanks to Netflix, Hulu, and Amazon Instant Video, consumers are watching more television content online, and on platforms that do not rely on having a cable subscription.


But in the face of declining subscribers to cable television, ESPN has defied logic yet again and invested $7.3 billion for the exclusive rights to broadcast the college football playoffs through 2025. This move coupled with ESPN’s utter dominance of sports content only serves to prove that even in the face of growing demand by sports fans for non-cable sports options, we sports fans aren’t any closer to being able to completely cut the cord.
 

How does the current system work?

The ESPN sports television ecosystem works as follows:
 
    1.  ESPN first secures compelling sports content preferably with exclusive broadcast rights by paying billions of dollars (i.e. $7.3 billion for the exclusive rights to the college football playoff)
    2. ESPN then convinces cable and satellite providers (The Comcast’s and DIRECTV’s of the world) that to carry ESPN in their cable packages.
    3. Cable and satellite providers shell out hefty monthly subscription fees for the “privilege” to carry ESPN and its network of channels[2]. ESPN costs $5.54 per subscriber per month while ESPN2 costs $0.70 per subscriber per month. ESPN News, ESPN Classic, ESPNU, and ESPN Deportes costs $0.20 per subscriber per month each
    4. Ultimately us sports fans are on the hook monthly for this expensive content through our monthly cable subscription bill. This is why most cable providers include ESPN in their premier or top tier cable packages.
 
At roughly 93 million pay-television subscribers[3], ESPN alone is pulling in a cool $6.18 billion yearly on just television subscriptions fees that it charges the cable and satellite providers. If you add in the fees it charges for its complete package (i.e. ESPN2 all the way to ESPN Deportes) and assume that a third of the subscriber base gets these channels (i.e. 31 million) total fees annually for ESPN total sports network jumps up to $6.73 billion!
 
 
As a point of comparison CNN and Fox News make $0.45 and $0.30 per subscriber per month.  Using the same pay-television subscriber base as ESPN, CNN and Fox News make a combined $836 million annually. Put another way, ESPN stand-alone makes +639% more than CNN and Fox News combined! With the current system, ESPN can practically cover the cost of their college football investment in just one year!
 
ESPN doesn’t stop at just subscription fees. Since it has exclusive rights to broadcast certain sporting events from Monday Night Football back to the College Football Playoffs, ESPN makes a boat load of money charging companies to air advertising spots during commercial breaks of games. This past college football playoff alone, ESPN charged $1.0 million per 30 seconds, and in 2014, ESPN made approximately $3.9 billion in ad revenues which was a +63% year over year growth.
 
Between growing subscription fees and advertising revenue, ESPN makes a ton of money in the current system and its primary motivation is to protect the pay-for-TV profits. There is zero incentive over the next decade for them to change this model … or is there?
 

Is ESPN actually in trouble of losing out in the digital age?

Estimates have stated that 94% of programming on sports channels is consumed live compared to 70% on network television[4]. To put this simply, there just aren’t too many truly live events that don’t allow you to skip ads.  So what in the world would make them consider changing the model? The short answers lies in the simple fact that even in the face of ESPN’s dominance over live sports, fans are still walking away.
 
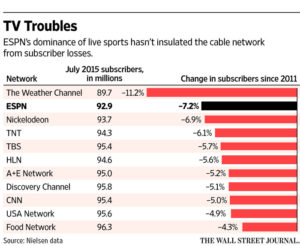
Earlier this year, Disney reported that it was trimming its forecast for TV subscriber-fee profit growth through next year because of subscriber losses at its flagship ESPN sports network[5]. Since 2011, ESPN has lost -7.2% of its user base, second only to the Weather Channel. Using the assumption that cord cutting is going to continue its acceleration over the next decade, ESPN could be looking at a subscriber base in 2025 of roughly 72.8 million, down -21.6% from its 2015 high of 92.9 million. By 2025 given these rates of falling subscribers, ESPN’s subscription fee revenue in 2025 would stand at only $4.84 billion, down from its 2015 high of $6.18 billion. Needless to say, if ESPN continues to stay the course it is in danger of losing large sums of revenue. But more importantly as the other media juggernauts have all experience over the past 10 years it’s only a matter of time before some digital start up comes in to eat your lunch.


Enter ESPN partnership with Sling TV
Through Sling TV (owned by Dish Network) and $20 a month users can get online streaming access to ESPN and ESPN2. An additional $5 a month gets you access to the Sports Extra package which includes ESPNU, SEC Network, ESPN News and a bunch of other peripheral ESPN channels. 


Sling TV is perfect for the college football cord cutter! This package is more than sufficient to ensure that you will get all the games you need, and it’s much cheaper than the average $95.73 that cable and satellite companies typically charge[6]. If you happen to be like me and care about watching other sporting events like the Barclay’s Premier League or out of market NFL games, you’re still stuck in the current environment with a satellite or cable provider. This lack of consistent sport programming across all sporting events is often the most cited reason why consumers stick with traditional cable subscriptions.
 
 
Given ESPN’s $7.3 billion investment in college football, its partnership with Sling TV is a step in the right direction. But it’s still not enough to completely force ESPN’s hand or other sports broadcasters to drive into stand along stream services. So at best, if you take to heart what Disney CEO Bob Iger recently said, standalone sports services wont’s roll out for another five years (insert sad face)


[1]UDLAND, MYLES. “This is the scariest chart in the history of cable TV” Business Insider. 18 Aug. 2015. Web Retrieved 25 Aug. 2015
 
[2] BADENHAUSEN, KURT. “The Value of ESPN Surpasses $50 Billion.” Forbes Business. 29 Apr. 2014. Web Retrieved 14 Sep. 2015
[3] RAMACHARNDRAN, SHALINI. “ESPN Tightens Its Belk as Pressure on It Mounts.” The Wall Street Journal. 9 Jul. 2015. Web Retrieved 14 Sept. 2015 
[4] DISCOVERY COMMUNICATIONS. “Time-Shifted Viewing & Commercial Retention Analysis.” Discovery Communications. 7 Jul. 2012. Web Retrieved 14 Sep. 2015
[5] NAKASHIMA, RYAN. “Pay TV industry shows cracks in media earnings.” Phys.org. 6 Aug. 2015. Web Retrieved 15 Sep. 2015
 
[6] KANG, CECILLIA. “ESPN will be available through a streaming service, no cable required.” The Washington Post. 5, Jan. 2015. Web Retrieved 15 Sep. 2015
 

Click Clack … Nike hears you Coming: Under Armour’s rise in the U.S. Sportswear Market

In the U.S. sportswear market, Nike has long held the number one spot. So much so that its Nike and Jordan brands account for more than 90% of the U.S. market for basketball shoes alone[1]. In the 2014-15 NBA season, 283 (63%) of the 440 NBA players wore Nike Shoes, and when you add in the players that wore Jordan Brand, Nike’s market share of the NBA players rises to 73.2%[2].
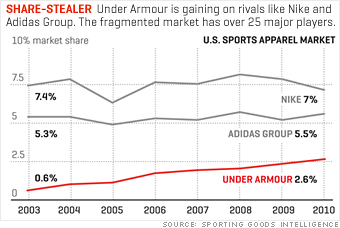
When you are sitting in second place looking up at the $28 billion revenue behemoth that is Nike you have to take risks and place strategic sponsorship bets. In 2010, Under Armour had approximately 2.6% of the total U.S. sportswear market.
Five years later at roughly $3.8 billion in revenue (projected this year revenue), Under Armour now sits in the No. 2 position within the extremely competitive U.S. sportswear market with a majority of that growth attributable to its meteoric rise in apparel sales.  And with a bit of good fortune on some of its recent sponsorship bets, Under Armour is poised to offer a serious challenge to Nike’s dominance in the U.S over the next decade.

Jordan Spieth

Under Armour’s first real bet on golf came in 2012 when a former Redskins defensive lineman started following a teenage Phenom named Jordan Spieth at Congressional Country Club[1]. As the story goes, Spieth was playing as an amateur at an event at Congressional Country Club and Ryan Kuehl, former Redskins defensive lineman happened to be there. As an executive at Under Amour, Kuehl knew that they were trying desperately to make a major play in golf, and after following Spieth for some time, Kuehl was certain that he had found the “Bryce Harper” of golf.
So in 2013 while Nike and Rory McIlroy were inking a 10-year estimated $200-$250 million deal, Under Armour took a risk and signed the 18 year-old newly turned pro to a multi-year endorsement deal for an undisclosed sum. And boy has that risk paid off for them in a big way.
At the ripe ole age of 21, Jordan Spieth has already won the Masters and the U.S. Open, and he has become just the sixth golfer to do so and only the second golfer in the last 44 years to accomplish this feat in the same year.
When you also consider overall popularity metrics, Jordan Spieth and Under Armour are simply killing it[1]:
 
35% of consumers knew who Spieth was before the U.S. Open, up from just 19% before the Masters
 
 In “overall appeal/likability” Spieth rose from No. 1,500 to No. 129 out of 3,600 celebrities
 
 In terms of consumers aspiring to be like certain celebrities, Spieth is No. 1 among athletes and jumped from No. 333 to No. 4 overall, trailing only Tom Hanks, Bill Gates, and Kate Middleton.
 
In terms of “endorsement value” Spieth is No. 5 overall and No. 2 in sports, trailing only Michael Jordan
Spieth signed at the beginning of this year (before he won his two majors), is the simple stroke of genius … and luck that Under Armour needs if it’s going to make a dent in the Nike dynasty.
With Spieth locked down until 2025, Under Armour Golf is poised to lead the way in the golf apparel industry for the next decade. And if the sales velocity and demand of the UA Drive One shoe is any indication, Nike’s pedestal is getting slightly less sturdy.
 
 
Under Armour Website as of August 12, 2015. The Jordan Spieth UA Drive One is still sold out!
 

Stephen Curry

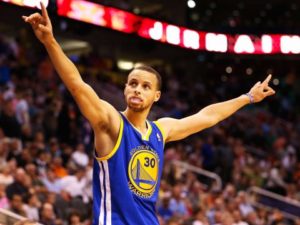
In 2013 when Nike passed on renewing his sponsorship contract and decided that Curry wasn’t deserving of a signature shoe, Under Armour welcomed him with open arms. With limited presence in the basketball shoe arena, Under Armour was looking to make a bigger play in this market. At the time, Curry was an exciting player but in Nike’s eyes he wasn’t necessary a superstar or franchise athlete “worth” investing large endorsement dollars in. Good thing Under Armour thought differently.
This past year, Stephen Curry averaged 28.3 points per game, shot 42.2% from 3, and won the NBA’s Most Value Player.
He also led the Golden State Warriors to their first NBA title since 1975.
Stephen Curry is second only to LeBron James in popularity, as evidenced by his #2 ranked selling jerseys on NBA.com.


Similar to the Under Armour Drive One Golf Shoe, Under Armour’s signature basketball shoe, The Curry One, is all but sold out. Not bad for your first basketball shoe!
 
 
Under Armour has a grand plan to turn their partnership with Stephen Curry into a $1 billion business alone and if they succeed, the $4 million a year they are paying Curry will look like chump change and continue to add fuel to the fire of Under Armour as they march along and try to continue to take market share from Nike.
 

On the horizon: The Texas Longhorns?

With Notre Dame already in the bag at a cool $90 million 10-year deal, Under Armour is now turning its eyes to one of the more historic/iconic college brands in America. Like it or not, the University of Texas rain or shine, lose or win year over year is an absolute cash making machine. With annual revenues of approximately $166 million, the University of Texas would be the ultimate coupe from Nike.
In May of this past year, it was reported that Under Armour made a $150 million offer over 10 years to the Texas Longhorns. While this may seem like a large sum of money for a collegiate program, Nike recently coughed up a cool $169 million to sign the University of Michigan to a long-term 10-year deal.
With a current roster of 13 other schools (Auburn, Hawaii, Maryland, Texas Tech, Boston College, Utah, Northwestern, St. John’s, Navy, Colorado State, South Florida, South Carolina, and Notre Dame), adding the University of Texas would the whale that they would need to bag to continue their meteoric rise.
Quick side note: Jordan Spieth went to the University of Texas. You think Kevin Plank isn’t chomping at the bit to use that in his negotiations with the Longhorns!
 
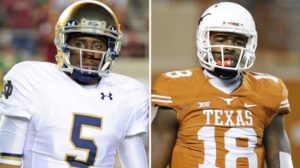
Imagine what the University of Texas vs. Notre Dame opening game next year in Austin would look like if both those teams were wearing Under Armour uniforms and both teams good again… I know Kevin Plank is dreaming of that day (as am I, especially in regards to the Longhorns being good but that’s for another blog post.)


Summary

At roughly $400 million (about 10% of total top-line revenue) in total sponsorship commitments this year, Under Armour is continuing its aggressive investments in high profile endorsement deals in an attempt to chip away at the empire that has been built by Nike. You often times have to spend money in places that you never would have considered in order to hit the jackpot and Under Armour’s two very risky strategy bets on Jordan Spieth and Stephen Curry are paying off in a huge way.
There is simply no denying that Under Armour is on fire and Nike must really consider the validity of their threat. This year Nike is planning on spending roughly $7.1 billion (about 25% of total top-line revenue) on total sponsorship commitments. When you add to this the $1 billion deal it just inked with the NBA in June, Nike is trying to combat Under Armour’s rise.
With other deals on the horizon, Under Armour is poised to continue to make serious runs at Nike, and while it seems unlikely that they will completely catch Nike there is no reason to doubt that this company won’t be a $6 to $10 billion company in the next decade.
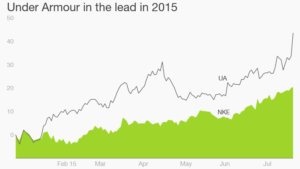
This year Under Armour’s stock hit an all-time of $98.46. Not bad for a company that IPO at $6.33 in 2005.
 
 
Click Clack Nike hears you coming!


[1]SCHLOSSBERG, MALLORY. “Under Armour is edging in on Nike’s territory.” Business Insider. 10 Aug. 2015. Web Retrieved 11 Aug. 2015
[2]GAINES, CORK. “Nike dominates the NBA shoe market and it is not even close.” Business Insider. 23 Feb. 2015. Web Retrieved 11 Aug. 2015

[1] STEINBERG, DAN. “Jordan Spieth and Under Armour: A former Redskins defensive lineman’s golf bet pays off.” The Washington Post. 23 Jun. 2015. Web Retrieved 12 Aug. 2015
[1] SIRAK, RON. “Golf’s New $25 Million Man* And that might be low.” Golf Digest. 15 July. 2015. Web Retrieved 12 Aug. 2015

College Football Nouveau Riche, the Rise of the Oregon Ducks and the Oklahoma State Cowboys and the Correlation to Influential Benefactors

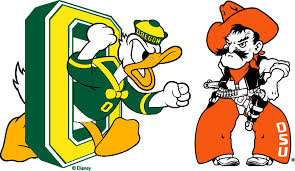
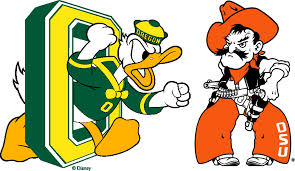
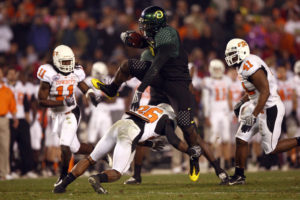
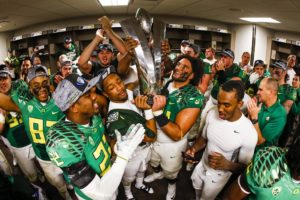
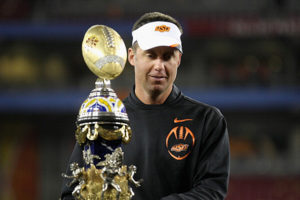
You have probably heard of the old financial axioms, “You have to spend money to make money,”, or “It takes money to make money.” Although we can find examples within our lives that counter this argument, nowhere do these axioms ring truer than in Big-Time college football. On December 30, 2008 in front of 59,106 fans, the 9-3 Oregon Ducks faced off against the 9-3 Oklahoma State Cowboys. In what would be a battle between two newer more financial wealthy programs (I’ll speak about this point shortly) and Oregon Coach Mike Bellotti’s final game, the Ducks beat the Cowboys in a thrilling 42-31 contest.

Fast forward to the present, as I sat watching the inaugural College Football Playoff final between Ohio State (old wealth) and Oregon (nouveau riche), I couldn’t help but smile as I watched the Oregon Ducks take the field. Just one week prior to the final, the Ducks played in their 3rd Rose Bowl in six years. And over the last decade, the Oregon Ducks boast a 106-26 record (80.3% win percentage) which is 4th best in college football; they have two national championship appearances, and four conference titles to boot.

There is absolutely no denying that Oregon’s meteoric rise to the top of college football directly correlates to their colossal increases in football specific spending. Since 2005, the University of Oregon’s Athletic Department’s spending on football specific activities averaged $16.7 million and has grown at a compound annual growth rate of +15.75%. And as mentioned before, during this same time period the Ducks have won four conference titles and have appeared in two national championships. For a school that captured a grand total of three conference titles from 1986 to 2004 this isn’t half bad! During the same time frame, the Oklahoma State University’s Athletic Department’s spending on football specific activities averaged $15.2 million and has grown at a compound annual growth rate of +9.93%. Over the last decade, the Cowboys boast an 83-44 record (65.4% win percentage) during which they also captured one Big XII championship and the 2012 Fiesta Bowl. For a school that captured a grand total of zero conference titles from 1986 to 2004 and boasted a very subpar 102-113 record (47.4% win percentage) things are definitely looking up.

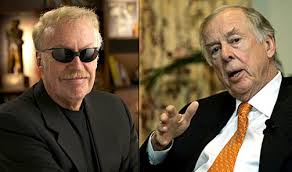
No two nouveau riche programs in college football have had more influential benefactors that these two programs. Phil Knight and T. Boone Pickens have each donated roughly $300 and $400 million to their respective Universities, with $265 million specifically going to the OSU football program. And just last year alone, Phil Knight gifted nearly $100 million to the Ducks and a new training facility for the football team[1]Given these very large financial contributions, I want to take a look at the financial data and compare the investments to wins and losses on the field. My argument here is actually quite simple: Oklahoma State and Oregon’s success is due in large part to the funding received from T. Boone Pickens and Phil Knight. The excessive levels of cash have transformed both of these programs into perennial powers that are here to stay, and the data will show how much.

Using a regression based analysis and looking at the financial data for the Oklahoma State and Oregon athletic departments since 2008 I focused on comparing wins-losses to the following five crucial variables for each program:

(1) Football Specific Contributions: money contributed by donors/benefactors designated to be use only for the football program.

(2) Non-Program Specific Donations: money contributed by donors/benefactors designated to be used for any athletic program

(3) Football Specific Expenses: money spent by the athletic department specifically on football activities.

(4) Non-Sport Specific Expenses: money spent by the athletic department on activities across all sports at the universities

(5) Marketing and Fund Raising Expenses: money spent on marketing initiatives to raise brand awareness for the universities’ athletic programs.

When considering financial investments in football, it is my opinion that the above mentioned five variables are the most directly correlated to wins and losses on the gridiron, and the data proves this point to a tee.

Looking at the regression outputs for wins for Oregon and Oklahoma State (see bottom of page for output), the Ducks have an R-squared of 95.8% and the Cowboys have an R-squared of 89.5%. What this means is that the financial data I selected (the five variables above) explains 95.8% of the variation in Oregon’s wins and 89.5% of the variation in Oklahoma State’s wins. Looking at the regression outputs for losses for Oregon and Oklahoma (see bottom of page for output), the Ducks have an R-squared of 88.7% and the Cowboys have an R-squared of 86.1%. What this means is that the financial data I selected (the five variables above) explains 88.7% of the variation in Oregon’s losses and 86.1% of the variation in Oklahoma State’s losses. Put even simpler than all of the above … Oregon and Oklahoma State should thank Phil Knight and T. Boone Pickens and make sure to do whatever they need to do to make sure that the money doesn’t ever stop flowing in!

In closing, all data naturally contains an amount of variability that is in-explainable and this simple regression model is no different. Simply because I obtained a very high R-squared value for each of the regressions that I ran, doesn’t mean that the actual model in and of itself is adequate. As we know with Big-Time College Football, it is more than simply a money game. You need great talent and good coaching to give you a chance to be successful (both of which Oregon and Oklahoma State have had over the last decade). You also need a bit of luck … But having more money to invest and spend on your football program is definitely going to help!


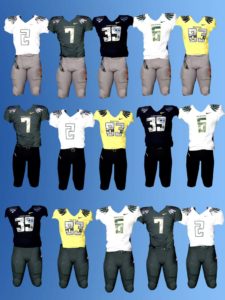
Fun Fact: Since 2004, the Oregon Ducks have not worn the same exact uniform for two games in a row (see pictures below)[2]. I guess money can also buy very nice swag … especially if that money comes from an ex-Nike CEO!


Regression Outputs:

Oregon Ducks – 2008 to 2014 Wins vs. Five Variables of Investment

Oklahoma State Cowboys – 2008 to 2014 Wins vs. Five Variables of Investment

Oregon Ducks – 2008 to 2014 Losses vs. Five Variables of Investment

Oklahoma State Cowboys – 2008 to 2014 Losses vs. Five Variables of Investment


[1] Matthew Kish, Portland Business Journal. (January, 21, 2014). Thanks to Phil Knight gift, Oregon athletic department likely tops in 2014. Retried from <http://www.bizjournals.com/portland/blog/threads_and_laces/2015/01/phil-knight-gift-oregon-athletics-top-2014.html?page=all>
[2] CBS Interactive Inc. (April 23, 2012). A gridiron fashion statement. Retrieved from <http://www.cbsnews.com/news/a-gridiron-fashion-statement/>

The data shows that financially self-sufficient athletic departments are tough to come by for programs outside the Power 5 Conferences.

In December of 2014, the University of Alabama at Birmingham (UAB) made headlines by shutting down their football program for good. UAB President Ray Watts simply found it too costly from both an operating and a capital investment standpoint to run the football program. To quote him specifically, 

“As we look at the evolving landscape of NCAA football, we see expenses only continuing to increase. When considering a model that best protects the financial future and prominence of the athletic department, football is simply not sustainable.”  


The last program to shut down major college football was Pacific in 1995, but looking at financial data from USA Today Sports[1] UAB is not alone in its “financial difficulties.” 

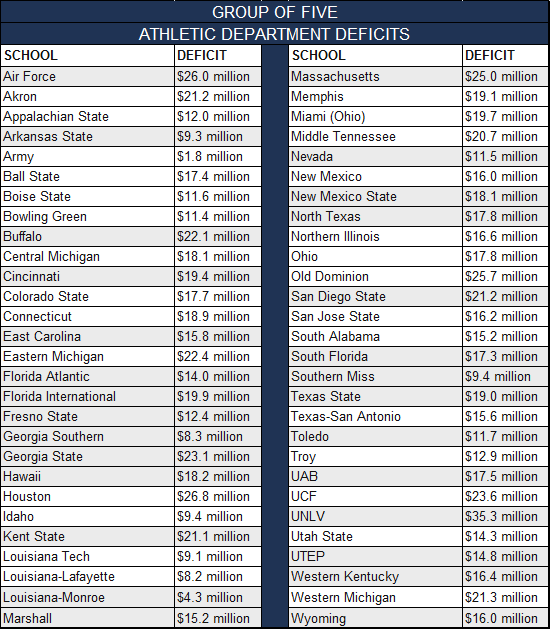
The vast majority of athletic departments for programs from the Group of Five (otherwise known as universities from mid-major conferences) are running significant deficits (See complete listing below in Appendix A). 


And what makes this financial situation worse is the fact that a majority of these public universities receive subsidies from student fees, direct and indirect institutional support and state money to help offset their costs. 


But unfortunately even with their financial subsidies, the average deficit faced by 56 of the 63 mid-major athletic departments stood at $16.8 million for the 2012-13 financial years, and this year the figures are no different.

In May of 2012 as part of a research paper on the BCS (see my first blog post here), I argued that Division I Football needed to downsize and the Group of Five schools were the sacrificial lambs. My argument was based on the simple fact that television revenue is the only means to generate financially self-sufficient athletic departments, and the Power 5 Conferences and Notre Dame will continue to obtain the lion’s share of the television network revenue. Regardless of whether or not you feel this is fair or unfair, these are the facts as Power 5 Conference schools have significantly larger fan bases across more regions of the U.S. than Group of Five schools, and television networks are willing to pay for their viewership.

With the new College Football Playoff era, the television payouts have only gotten bigger and bigger. In 2011, the total payout across all the BCS bowls and non-BCS bowl games amounted to approximately $303 million. For the exclusive rights to broadcast the seven games of the College Football Playoff each year, ESPN is paying a reported $7.3 billion over 12 years. This package includes the four major bowl games, two semifinal New Year’s Day bowl games, and the national championship. ESPN is willing to pay an approximate $606.3 million annually for the right to broadcast seven games and this is on top of all the other large sums of money that they already shell out to the Power Five Conferences for the regular season games! After the CFP executives have taken their cut, the conference payouts break out as follows[2]:

With 14 members in Conference USA, 13 in the Mid-American conference, 12 in the American Athletic conference, 12 in the Mountain West, and 12 in the Sun Belt, the 63 member schools of the Group of Five split $60.0 million among themselves; And if they split it equally, this breaks down to roughly $953K per school. Given these measly contributions from television revenue, the question remains how in the world are the member schools of the Group of Five supposed to drive financially self-sufficient athletic departments and still support football programs?

Since 1999 no Group of Five football team has had more success than the Boise State Broncos.They have won three Fiesta Bowls during that time frame and they have finished in the Top 25 ten times with an average final ranking of 11.4 in the AP Poll and 10.6 in the Coaches Poll during this time frame. 

And this past year, Boise State continued its rise by defeating Pac-12 school Arizona 38-30 in the Fiesta Bowl. Given this unprecedented success, one would expect that of all the Group of Five schools, the Boise State athletic department would be the closest to financial self-sufficiency. Unfortunately as the chart in Appendix A below details, Boise State’s on the field success hasn’t led to financial self-sufficiency for the athletic department. So I return to this question of financial self-sufficiency … 

How does a member school of the Group of Five drive a financially self-sufficient athletic department while supporting football?

The short and simple answer is schools from the Group of Five simply can’t support collegiate football at the highest level, and athletic departments that strive to be financially self-sufficient will have to make the hard choice to sacrifice football. The long and complex answer lies around further conference expansion and inclusion of certain member schools from the Group of Five into the Power 5 Conferences. As expansion talks continue to heat up within the Big XII, mid-major football programs like Boise State, Cincinnati, Memphis, and University of Central Florida (UCF) to name a few will continue to be tossed around as potential candidates for inclusion. But the reality is without inclusion into one of the five power conferences, universities from the Group of Five have zero chance of closing the financial gap.

**One thing to note is that financial information for private institutions is very challenging to come by so my analysis for this post has focused on public universities only**


Appendix A – Significant Deficits run by Group of Five School for Financial Year 2012-13


[1]Jon Solomon. (November 25, 2014). UAB football isn’t alone in losing money for athletic departments. Retrieved from http://www.cbssports.com/collegefootball/writer/jon-solomon/24839675/uab-football-isnt-alone-in-losing-money-for-athletic-departments
[2]Kristi Dosh. (December 8, 2014). College Football Playoff: Conference Payouts. Retrieved from http://businessofcollegesports.com/2014/12/08/college-football-playoff-conference-payouts/

UEFA’s Financial Fair Play Regulation protects Europe’s elite football clubs and Chelsea F.C. have benefited from the timing of its implementation.

 “With 50% of clubs losing money we need to stop this downward spiral. They have spent more than they have earned in the past and haven’t paid their debts. Continued excessive spending has been justified by club executives as being necessary to keep competitive but it is this excess spending that has brought a number of clubs to the brink of financial ruin. This needs to stop and Financial Fair Play Regulation is the means.”
-UEFA President Michael Platni
 

Introduction

UEFA’s Financial Fair Play Regulation (FFP) was first agreed in principle in September of 2009 after a review showed that more than half of the 655 European clubs suffered an operating loss over the previous year. Introduced amid concerns regarding the heavy spending of a number of professional clubs across Europe, FFP in principle will attempt to prevent professional football clubs from spending more than they earn in the pursuit of success. Set for complete implementation for the 2014/2015 UEFA season, clubs will be forced to comply with FFP or face a variety of sanctions, the ultimate penalty being disqualification from the lucrative Champion’s League. For the biggest clubs within the English Premier League, what is really at stake is £60m in prize money and television rights given to the winner of UEFA’s Champions League.
 

Principles within UEFA’s Financial Fair Play Regulation

The basic principle behind FFP is for a football club to spend no more than it earns in a given fiscal year. For a football club, turnover (income) is generated through ticket sales, television revenue, advertising, merchandise sales, player sales, and prize money from tournaments participated in, while expenses take the form of outgoing club transfers, employee benefits, and player wages. FFP takes a look at the revenue a club makes and the expenses a club sustains, and applies a threshold to determine compliance with UEFA regulations (see Figure 1 below). Money spent on long term investments like infrastructure, training facilities, or youth development academies are not included in the FFP evaluation. In theory, this principle is basic enough, but the reality is European football is about winning now at all costs and overspending breeds success.
 
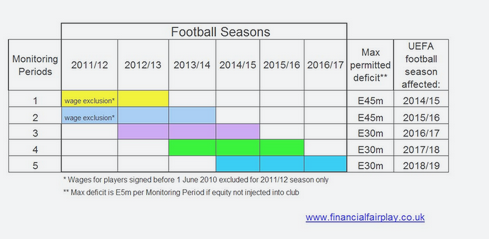
Figure 1: Financial Fair Play Monitoring Periods and Thresholds


Compliance with UEFA’s Financial Fair Play Regulation

The first monitoring period of FFP covers the 2011-12 and 2012-13 fiscal years and compliance with FFP will affect the 2014/15 season. During this period of time, football clubs that sustain losses greater than £4.1m (€5 million) must obtain equity injections from their owners. In essence, the owners of the football club must be willing to back the losses greater than the initial threshold hold of £4.1m (€5 million). The max aggregate loss that a club can sustain during this first monitoring period is £37.2m (€45 million).
 
As of February 28th of 2014, UEFA announced that seventy-six clubs are currently under investigation for potential financial fair play violations and consequently UEFA has required these clubs to submit additional financial information. And in May of this year Paris Saint-Germ (PSG) and Manchester City were both slapped with roughly £50 million (€60 million) fines and a reduction of their squad to 21 players for next season’s Champions League.
 
Given the parameters of FFP, I will examine the current state of compliance by Chelsea F.C. and argue that FFP falls short and prevents future clubs from emulating Chelsea’s strategy for success, thus ensuring the continued dominance of Champions League by Europe’s footballing elite.
 

Case Study: Chelsea F.C. 2003 to the Present

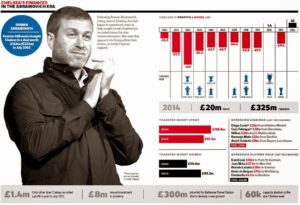
Since Roman Abramovich took control of Chelsea F.C. in 2003, the Blues have incurred heavy losses due to over spending and investing on new players and fresh talent. The Abramovich reign has brought in an estimated 80 different players at approximately £801m in gross transfer market spend[1](not including the additional £91.3m spent this summer on Cesc Fabregas, Filipe Luis, Loïc Rémy, and Diego Costa, and the £72.1m spent on the salaries for 10 different managers). As depicted by the graph below, Chelsea F.C. has spent heavy and often on players since 2003:


But during this time, this over-investment in players has led the Blues to unprecedented success on the pitch. Since 2003, Chelsea F.C. has won 3 Premier League Titles (2005, 2006, 2010), 4 FA Cups (2007, 2009, 2010, 2012), 2 League Cups (2005, 2007), and 1 UEFA Champions League Title (2012). During this time frame they have finished in the top 3 of the English Premier League in every single season apart from 2012, and they have reached the Semi-Finals of Champions four times (2004, 2005, 2007, 2009) also making it to the finals in 2008 against Manchester United.


To put this in context, Chelsea F.C. has won a total of 28 major trophies since the club’s inception in 1905 and 13 of these trophies have come since 2003. 46% of Chelsea’s all-time trophies have come in the span of 11 years and this meteoric rise to relevance is directly tied to the investments that Roman Abramovich has made.
As UEFA’s Financial Fair Play Regulation compliance continues to kick along, I can’t help but belief that implementation of FFP will prevent clubs outside of Europe’s elite from quickly rising to prominance. And given the penalties within FFP the days of Chelsea F.C. incurring huge losses due to overspending on players appears to be at an end.
 

Chelsea F.C. Key Financial Statistics: 2003 to 2014

Utilizing financial information obtained from TheChels.co.uk[2], I have compiled the following charts of key financial statistics for Chelsea F.C.:


Since 2003, Chelsea F.C. have experienced a +10.2% CAGR in Annual Turnover due primarily to signficant increases in revenue from business partnerships/sponsorships (see 10-year, $450 million kit deal with Adidas), and this past year (fiscal year ending June 30, 2014) Chelsea F.C. recorded a record breaking £18.4m profit. This record profit for 2014 ensured that FFP regulations have been satisfied for the upcoming year.
 
For the first time in Chelsea F.C.’s financial history, the club finances a majority of their transfer spending with money generated by the sale of players. As an example, for the 2014/2015 summer transfer period (as mentioned above), Chelsea F.C. spent approximately £91.3m, but this sum was matched with approximately £75.2m in fees generated from the sales of David Luiz, Demba Ba, and Romelu Lukaku[3].
 
Chelsea’s financial maturity is also flowing into its overall valuation as Chelsea’s value has risen by +84.7% from approximately £275m ($555m) in 2007 to £508m ($868m) in 2014. It took the Blues 11 solid years to reach its current level of financial stability, and now that they have established themselves as one of Europe’s elite football clubs, they stand to benefit from the very sanctions that would have threatened their meteoric rise in 2003 had they been around. And this fact is my biggest beef with FFP!
 

Why FFP falls short of the Mark

Chelsea F.C. is now safe in the short-term from FFP sanctions simply because their frantic over spending and investment in players to establish themselves in Europe occurred during a time period when FFP sanctions were none existent. They are now reaping the benefits of this investment as they enter a period of financial stability and maturity, the likes of which, we haven’t seen in West London during the Abramovich era. Big clubs have already spent their money investing in talent before these regulations have come into play allowing them to solidify their positions within Europe based solely on the first mover advantage.
 
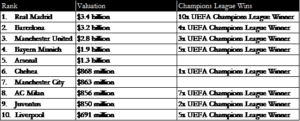
FFP simply put benefits the teams that are already economically powerful and already have deep histories with even deeper followers. Looking at the list of European clubs atop the Forbes valuation, you start to see pretty quickly it is a who’s who of stable elite:


Of the 59 winners of UEFA’s Champions League, the trophy has been won 37 separate times by one of the 10 teams on this list. 62.7% of the time, one of European’s elite clubs lifted the trophy. And when you stop to consider this fact, you realize pretty quickly that these FFP regulations are a “contradiction” only set up to serve and protect Europe’s biggest clubs[4]. On top of this, the fines that are compiled by UEFA from the violators of the Fair Play Regulations are then distributed back to the clubs who successfully complied with the rules; in effect further robbing Peter to pay Paul!
 
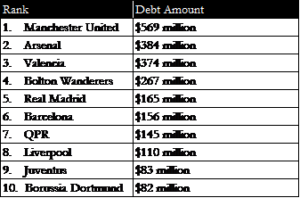
But while FFP regulation attempts to prevent football clubs from over spending, it has done absolutely nothing to prevent owners from saddling football clubs with massive levels of debt. Leveraged buyouts continue to load European football clubs with massive levels of debt as the result of debt financing by new owners, and FFP has done little to address this problem, which in my opinion is a much greater problem to the financial stability and future of European football. As of February 2014, the top 10 football clubs with the most amount of debt were as follows[5]:


The world’s second most valuable club, Manchester United is the number one club in terms of debt accumulation. And even though they pass FFP regulations hand over fist from a cash flow standpoint, 20.3% of their valuation is tied up in debt. So in essence, FFP penalizes football clubs like Chelsea, Manchester City and PSG who finance their operations solely by direct cash injections, and rewards football clubs like Manchester United and Real Madrid who finance their operations utilizing massive debt and money from massive sponsorship deals
 
UEFA’s Financial Fair Play Regulation originally set out to clean up the financial activities of Europe’s biggest football clubs but if falls short of this mark. Timing of investing activities has given Europe’s elite clubs a first mover advantage and regulations have done very little to tackle the debt carried by these large clubs. FFP simply benefits the football clubs who are willing to take on more debt over those clubs who finance their operations via cash. And it is this very punitive nature of FFP that is simply maddening.  FFP has placed the “new clubs” at a disadvantage compared to the historically old big clubs, in this fight for European relevancy.
 
Disclaimer: I am a Chelsea F.C. supporter and the opinions expressed above are solely my own.

The 5-5 Plan (Five Years-Five Tiers) Payment of NCAA Football Players by Chris Brooks

“Twenty years ago, 50 years ago, athletes got full scholarships. Television income was what, maybe $50,000? Now everybody’s getting $14, $15 million bucks and they’re still getting a scholarship.”

-Steve Spurrier

Introduction

In 1949 the NCAA enacted the “Sanity Code” which prevented college athletes from receiving any direct or indirect benefits as compensation. At the time the rule made sense, but as Steve Spurrier mentions above NCAA Division 1A Football (or Football Bowl Subdivision “FBS”) was not the big business in 1949 as it is today and the time has come to revise the rules to reflect the change in times. Today the NCAA Football economy draws over $3 billion in revenue on a yearly basis, with many of its bigger programs earning over $50 million in profits; yet its players are compensated no differently than in 1949. The players who are responsible for generating such revenues are only compensated by receiving free tuition (non-guaranteed past one year) and a small monthly housing allowance. To make matters worse, student athletes are only guaranteed one year of free tuition when they sign a letter of intent, yet coaches can prevent an athlete from transferring to another institution to play football; the system takes advantage of the very people it claims to protect.

According to a report by the National College Players Association, “an advocacy group for college athletes found that the average full scholarship at a Football Bowl Series university lacks $3,222 in educational expenses, including everything from parking fees to utilities charges. Just paying players this much, the report says, could “reduce their vulnerability to breaking NCAA rules.”2 Coaches receive multi-million dollar contracts yet the people most responsible for the product on the field are left frustratingly uncompensated. In the words of 1991 Heisman Trophy Winner Desmond Howard, “You see everybody getting richer and richer, and you walk around and you can’t put gas in your car? You can’t even fly home to see your parents?”

These institutions and conferences are not the only ones getting richer; the NCAA and the
corporations involved make a great deal of money as well. What is most flabbergasting about this situation is that the NCAA claims that they are “protecting student athletes” by forcing them to maintain their amateurism. In order to be eligible to compete in the NCAA, every student athlete must sign a “Student Athlete Statement” which ensures their status as amateurs by waiving their right to benefit financially from their athletic performance. While the players “waive” their right to earn money from their accomplishments, the NCAA and member institutions continue to make money off of the players on and off the field, using players’ likeness for advertising and other purposes. Even more appalling is that many athletic departments do not allow their athletes to take classes that could get in the way of their athletics. This leaves athletes unchallenged in the classroom and unable to capitalize on the free education which they are receiving. It is laughable to believe that
any of this “protects” the student athlete? Last year the NFL paid their players over $35 million for using players’ likeness in an Electronic Arts video game while the NCAA did not compensate a single athlete for a similar game. How does a student athlete benefit when their likeness is used and they do not receive any compensation? The fact is that these 18-21 year-olds serve as free labor for a multi-billion dollar industry where powerful institutions take advantage of the young and less educated, and it is time for the NCAA to remedy its past discretions.

In order for the NCAA to rid itself of the corruption that exists and create a fair system where everyone prospers, it is necessary to pay the players and grant them the rights that they have not had to this point which will allow them to have a better chance for success in the future, both on and off of the field. We propose a plan that will force teams to pay their players and also implement a salary cap system. Creating a salary cap system will not only fairly compensate the athletes it will help enable parity in the recruiting process across all FBS programs. The plan also will ensure that every FBS college football player is guaranteed five years of education and that players are be covered medically for life for any injuries sustained while on the field of play.

Plan

The basis of the plan will be two sided. One side will discuss the salary cap system and the other will focus on the education and health guarantees in which the student-athletes are entitled to receive.

Risks

Before getting into the details of the 5-5 Plan, it is important to recognize that there are a number of risks in the NCAA allowing athletes to receive a salary. The United States judiciary system would become involved in labor issues and it is possible that the NCAA would face heavy legal battles once they have recognized the athletes as employees. Athletes could attempt to unionize and make certain demands which could jeopardize the goals of the 5-5 Plan. Despite the risks, we believe that this is the most appropriate way to compensate the athletes without compromising the integrity of College Football. These student athletes are unpaid labor and we believe that the NCAA needs to make drastic changes in order to live up to their commitment of doing what is best for the student athlete.

Five Years

Since 1973 the NCAA has prohibited member institutions from guaranteeing athletic scholarships for more than one year; as a result players are vulnerable each year to not having their scholarship renewed. Analysis of top Division I basketball teams show that 22% of scholarships were not renewed from 2008 – 2009. This decision falls on the shoulders of the coach, and in cases where players do not perform up to expectations; players will be released from their scholarship and be forced to pay for school if they want to remain enrolled. Considering the amount of money that these institutions make off of these players, we feel that it is irresponsible for the coaches to have the authority to discontinue a student-athlete’s education, unless the reason has to do with a clear
cut disciplinary action. The one-year rule effectively allows colleges to cut under-performing student athletes just as pro sports teams cut their players which is counter to the NCAA’s claim that its highest priority is protecting education.

We propose that each player be guaranteed five free years of education in exchange for signing a letter of intent. Unless the player is removed for disciplinary purposes or volunteers to quit the team, the player will receive the five year scholarship regardless of on field performance. We believe five years make more sense than four because of the rigorous schedule that football players undertake.

Recently there have been cases reported at UNC where players have been forced to enroll in easier courses because anything more difficult would conflict with their commitment to the football program.3 This situation is not unique to just UNC as players across the country deal with these same restrictions from their athletic department. Only 2% of NCAA Football players are drafted by NFL teams and these Universities need to give each player the opportunity to be in the best possible situation for the future. Not all players will take advantage of a fifth year, however given the demands on these players it is essential that these players have five years to complete their studies to prepare themselves for life after football.

Five Tiers

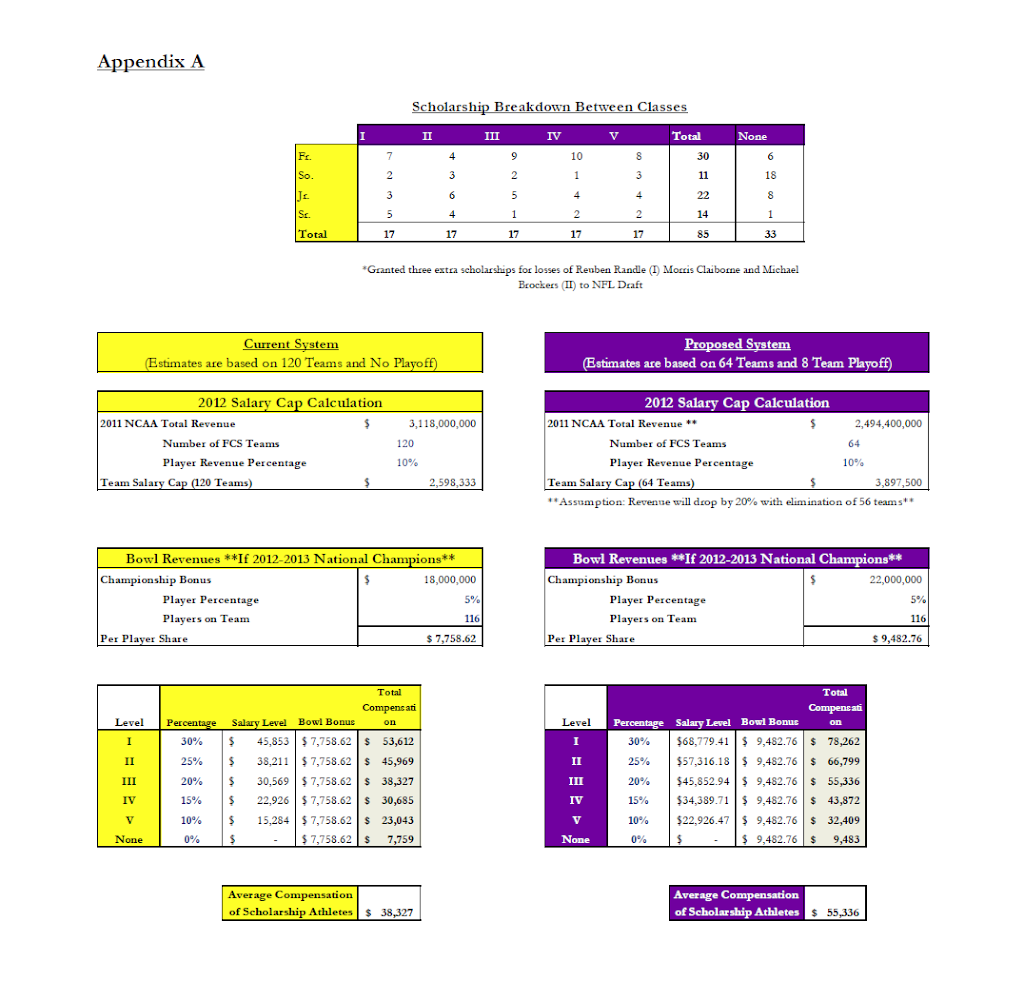
The NCAA would adopt a five-tier salary cap system which would be based on revenues from the previous season. For professional sports in North America the players receive on average about 50% of league revenues from TV contracts and ticket sales. Taking into account that the players are still in college, the student athletes will share 10% of all pre-bowl revenues. Each FBS school will have the same salary cap in which to pay the players, the sum of which across all schools will make up the 10% of league wide revenues. Tuition costs will not count against the 10% of revenues.

Under the new system, each team will be allowed to issue 85 scholarships, the 85 will be broken into five levels of scholarship; seventeen players will be allocated to each tier. Every player would be guaranteed five years of scholarship in addition to their salary. Players will earn a salary as long as they are on the team’s roster and still carry eligibility to compete. If a player has exhausted his eligibility after four year, he will still have a year of scholarship remaining however he will not receive a salary since he is ineligible to play football. The player’s salary is not guaranteed each year, however if a player from the “I Tier” is dismissed from the team, the team cannot re-allocate that tier to another player unless unique circumstances exist. The only way for a team to re-use one of the spots is if a player either transfers or turns professional. If a player transfers between institutions
they are not permitted to join another school at a higher salary level.

I Tier – 30% of salary cap (17 players)
II Tier – 25% of salary cap (17 players)
III Tier – 20% of salary cap (17 players)
IV Tier – 15% of salary cap (17 players)
V Tier – 10% of salary cap (17 players)

Tier Mobility

Any player has the ability to be moved up to a higher tier of salary; however no player can be unwillingly demoted to a lower tier. Coaches may dismiss a player from the team and end his salary; however that tier scholarship cannot be re-used on another player, existing or incoming unless special circumstances apply and it is approved by the NCAA. This will prevent coaches from shuffling players between levels and trying to manipulate the system. If a player chooses to transfer to another FBS school, they will still have to sit for a year and will not be able to join their new team at a higher tier than they had been previously. This will prevent coaches from having the ability to lure players at lower tier levels by offering them a better compensation package. If a player declares for the NFL Draft their scholarship will be vacated and eligible to use on another player. A walk-on
can be rewarded with a scholarship within a team at any tier, however if the walk-on chooses to transfer they may only enter at a “V Tier” scholarship.

Bowl Bonus

At the end of each year the players will share 5% of revenues from their University’s Bowl winnings. Unlike the salary cap system where each tier of players receives a different salary, each player on the roster will receive the same portion of the revenue, including non-scholarship players. The Bowl Bonus serves as a reward for the teams that perform better over the course of the year and incentivizes players to perform at the highest level regardless of which bowl their team participates.

Partial Lifetime Benefits

One of the most important tenants of this plan will be the partial lifetime benefits for which players will be eligible. This is clearly be a sticking point with many of the Universities; however we feel strongly that if a player is injured during his college football career the onus should fall on the University to make sure that player is covered financially for any future bills they might incur. The plan would leave each FBS team responsible for the insurance of each of their players and responsible for any long term injuries sustained on the field of play during their college career. When an injury occurs, team doctors will document the injury, the rehab as well as the long term prognosis. If it is proven that a player is suffering after the end of their career because of injuries sustained on the field during college practice or play, the responsible University and their insurance company will be responsible for paying the athlete’s benefits. Under the 5-5 plan, players will have
lifetime coverage for these injuries. It is unfortunate enough that players are not currently paid in the FBS, but it is simply tragic that players who experience devastating injuries do not receive continued medical coverage from the institutions that make millions off of them.

Endorsement Opportunities 

Under the new system players will not be able to receive individual endorsements and will not be compensated by the university for apparel endorsements. The reasoning behind this is that allowing players to be compensated in an unregulated fashion would detract from the salary cap system because boosters would be able to influence the system. The point of the salary cap is to keep all universities on an even playing field, if players are allowed to receive unregulated money than the scholarship tiers become useless because players would flock to the schools which have the most money.

Preventing Cheating 

One of the goals in paying players is that it would prevent the cheating which occurs today; in order to accomplish this goal the NCAA would have to increase severity of the penalties on cheating institutions. In 1986, Southern Methodist University was handed down the “Death Penalty” after proof surfaced that players had been paid by boosters; it was the harshest penalty in NCAA Football history. However since the SMU incident, infractions have continued yet punishments have become less severe. Over twenty NCAA Football programs have been eligible for the “Death Penalty” since 1986, but none have received it and most believe no program ever will again. A study by CBS Sports4 revealed that over the past 25 years the majority of NCAA teams that have been penalized have had a higher winning percentage in the five years after receiving punishment than in the five years before receiving the punishment. For the NCAA, an organization which prides themselves on fairness and preventing competitive advantages through the recruiting process, this is unacceptable. A team which continually breaks NCAA rules should receive harsh punishments and only on the rare occasion be able to return to a high level of competition in the years after the infraction was committed. The problem is that with all of the money on the line with TV deals and advertisements the NCAA would rather give a program a minor infraction than to cripple the program with a “Death Penalty.”

The way to solve this problem is to become far stricter on rule enforcement and notify teams that any infractions will not only result in harsh penalty, but players (the ones found innocent) will be allowed to transfer to another institution without sitting out or forfeiting a year of eligibility. The return of the “Death Penalty” with a transfer provision would change the way that teams operate and deter them from cheating in the future. If teams believe that they will lose future seasons and the current players will be allowed to jump ship without penalty more will do their best to run a clean program.

Downsizing of Division 1-A 

One of the most significant effects that a salary cap would have is the elimination of noncompetitive teams in Division 1-A. There are currently 120 FBS schools in the NCAA, each of these teams is eligible (in theory) to win the National Championship. The problem is that there is such a disparity in talent and money between the top 40 and the bottom 40 teams that rarely do the bottom 40 teams ever have a chance at post season play. There is very little mobility from the bottom part of the FBS because financially these teams are unable to compete with bigger schools and bigger budgets. For example, the bottom 40 schools in the FBS in 2010 averaged roughly a paltry 18,000 fans per game. Contrast this to the top 40 which averaged roughly 80,000 fans per game and the middle 40 which averaged a respectable 45,000 fans per game. Lower attendance in addition to the
smaller TV contracts which the lesser teams receive would force many of these bottom teams to move from the FBS to the FCS in order to remain affordable for their University. Downsizing the FBS to 64 schools would allow teams to drop the bottom-feeders and allow the better teams to play a more competitive schedule.

Creation of Parity = Increase in Quality 

Creation of a tiered salary cap system would create recruiting parity across Division 1-A football schools. With players only permitted to receive compensation through their tier of scholarship, the salary cap system would force each team to spend the same amount of money on the players, which in turn would create a level playing field for recruiting. A level playing field for recruiting would prevent the typical top schools from attracting all of the top talent because it would be financially beneficial for a player to go to a lesser program if they received a higher level of scholarship at that institution. In 2012 each of the top five schools had 15+ recruits that graded out at four-stars or better, including 15 of the 33 five-star players. Of the teams outside the top 20, none had more than 1 five-star recruit and all but five schools had less than 5 players ranked as four-star players. These rankings are not always indicative of the success that these players will achieve as college players, however with such inequality in the recruiting process it is no surprise that the same teams battle for the National Championship every year.

One side-affect to greater recruiting parity would be an increase in quality and player development in college football. One of the disadvantages for players with the current recruiting process is that when the best players go to the same schools, some great players have to sit on the bench because they are playing behind a better player. There are many cases where these players do not develop properly due to a lack of playing time and miss the opportunity to continue their football careers. If these players instead went to places where they would play right away, more of the top prospects would have the opportunity to receive playing time and develop rather than to sit on the bench and
wait for a star player in front of you to graduate. If the best players were spread across all FBS teams not only would the quality of play improve but with higher quality opponents on a weekly basis more players would likely reach their potential.

The above paper was written in May of 2012 by my friend and colleague, Christopher Brooks, during our final year at the Darden School of Business in conjunction with my paper on the BCS.

1.“BCS Must Change and TV Will Lead the Way” Nwokedi, Brian
2. http://online.wsj.com/article/SB10001424053111904060604576572752351110850.html
3. http://www.nytimes.com/2012/04/10/opinion/nocera-football-and-swahili.html
4. http://www.cbssports.com/collegefootball/story/15312728/major-ncaa-violations-yield-relatively-minorconsequences

To Defense, or To Offense … That is the question posing the Houston Texans on May 8, 2014

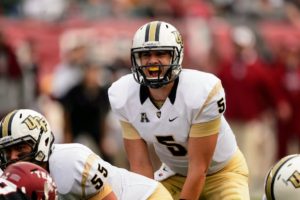
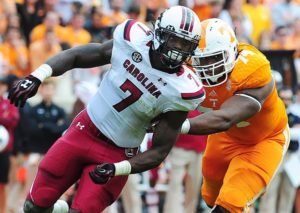
With the No.1 overall pick in the 2014 NFL Draft, the Houston Texans have to ask themselves one “very-simple” question: To Defense or To Offense? Regardless of which expert you chose to listen to the fact remains that on May 8, 2014 the Houston Texans will select Jadeveon Clowney or a quarterback with the number one pick. The top three quarterbacks in this year’s draft class are Teddy Bridgewater, Johnny Manziel, and Blake Bortles, and below I have compiled their college career stats:


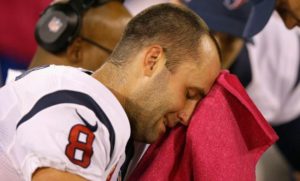
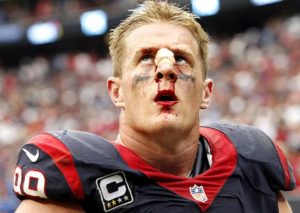
Teddy Bridgewater is the most polished from the pocket of the three while Johnny Manziel is hands down the “most exciting” of the three. On the flip side, Blake Bortles is probably the most physically gifted of the three with the most pro-upside of the group. And when you consider the Texan’s quarterback play this past year, there is simply not doubt that the Texans clearly need an upgrade at this position (see Matt Schaub struggle face below):


This past season the Houston Texans’ passing game ranked an abysmal 22nd in completion % at 58.6%, 24th in yards per attempt at 6.02, 25th in touchdown passes with 19, and tied for 3rd in most interceptions this season with 22 (thank you Matt Schaub aka Mr. Pick Six). Additionally, the three Houston Texan QBs combined passer rating for the 2013 NFL season was 74.0 with a TD% rate of 3.0. The 16 combined passer ratings of their 16 opponents was 93.9 with a TD% rate of 6.0.


So without question, the Texans are in the market for a quarterback. But I am of the opinion that the top three QBs in this year’s draft class aren’t worthy of the No.1 pick. None of the three are “can’t miss” type QBs like Andrew Luck or RG3 (although some might say he was a miss based on this last year’s lack of productivity and character issues). And the rise of Colin Kaepernick and Russell Wilson prove that a future franchise QB can be found in the later rounds.


Given the uncertainty of the top three QB prospects and the gravity of missing with the No.1 overall pick (remember the Houston Texans once drafted David Carr No.1 and look how that turned out), it is my opinion that the Texans use the No.1 overall pick and draft Jadeveon Clowney.


Drafting Jadeveon Clowney and paring him with JJ. Watt would allow the Texans to create one of the most ferocious and relentless pass rushes in the league (similar to Robert Mathis and Dwight Freeney for the Colts in the mid-2000s). He is the most physically gifted athlete in the 2014 draft and when he plays full tilt, he’s the most un-blockable player in this draft. And when you consider that the Texans play in the same division as Andrew Luck, building a stout front-seven makes more sense to me with the No.1 pick than risking it on Johnny Football, Mr. Bridgewater or Blake Bortles. 


Drafting Clowney doesn’t come without risk. During this past season he was often accused of “saving himself” and “taking plays off” as he struggled to give 100% effort on every play. His overall physical shaped was even questioned at the beginning of the season in the opener against North Carolina. And as the NFL continues to evolve into more “character-based” decision making, many NFL scouts have taken notice of these red flags when accessing Clowney’s draft stock. 


In 2006, the Texans were faced with a similar question with the No.1 overall pick and made the decision to draft Mario Williams over both Reggie Bush and Vince Young. I am asking owner Bob McNair and general manager Rick Smith to do the same thing …

Draft me a Clowney and find me a Russell Wilson in the later rounds!


P.S. Texans take a look at acquiring Kirk Cousins and drafting Jimmy Garoppolo from Eastern Illinois at QB. For those that don’t know who I am talking about Google him.

Past performance is no guarantee of future success. In Charlie Strong’s case it is.

158 wins to 48 losses…

That’s Mack Brown’s record during his 16 year coaching career at the University of Texas; a coaching career that saw him go 3-1 in BCS bowls, win a national championship, play for another, win 2 conference titles, and make the University of Texas a whole lot of money in the process. And notwithstanding his recent struggles over the past four years (30-21), his consistent struggles against Bob Stoops and Oklahoma (7-9), and the general feeling that the Longhorns underachieved during his tenure, Mack Brown is responsible for the resurgence of a Texas program that lay dormant for 30+ years since its 1969 and 1970 national championships. So before I continue on to talk about the topic at hand … Charlie Strong and the future of the Horns … I want to do something that I never did enough of during the Mack Brown Tenure:


“Thank you Mack Brown for 16 solid years. With its own television network and a valuation of $139M you have created a secure foundation for the future of the Longhorns, and you are a big reason the University of Texas is relevant again in college football. You have always been a class act in the face of all the scrutiny from spoiled fans like me. I truly wish you the best in the next endeavor (hopefully a color commentary spot on Longhorn Network?).” 


Today, the Texas Longhorns will “officially” name Charlie Strong their 29th coach and this appointment will mark the first time a black head coach will be in charge of a major men’s sport (football, basketball, baseball) at the University of Texas. If the reports are accurate, Charlie Strong was probably not the Longhorns first choice. But in my opinion, the appointment of Charlie Strong is the right overall move from a football X’s and O’s standpoint. He will right the defensive side of the football for the Longhorns and ultimately jump start the program back to its winning ways.


At 53 years of age, Strong’s resume speaks for itself; especially on the defensive side of the ball. While at South Carolina in the early 2000s, Strong bucked traditional defensive formations and invented the 3-3-5 stack defense. Predicated on speed, athleticism, and a “fly around a play football attitude,” the 3-3-5 stack placed a myriad of “hybrid” defenders on the field that could do multiple things to disrupt offensive schemes (especially the spread). The result of Strong’s defensive innovation was an 8 game win improvement (8-4 overall after an 0-11 season the year before) for the Gamecocks and an Outback Bowl victory over the Ohio State Buckeyes.

After his three year stint with the Gamecocks, Charlie Strong went on to serve as the defensive coordinator for the Florida Gators from 2002 to 2009. And as the defensive coordinator of the Gators, Strong more than proved his worth with top rated defenses in the 2006 and 2008 national championship years. 

Specifically:


2006
2008
Points per game:
13.5 (7th)
12.8 (5th)
Yards per game:
268.8 (10th)
279.3 (8th)
Total sacks:
36 (5th)
31 (11th)
Total interceptions:
21 (4th)
26 (1st)
Pick 6s
1
5


In the 2006 national championship game against the Ohio State Buckeyes, the Gator defense held the Buckeyes to 82 yards in their 41-14 victory. In the 2008 title game against the Oklahoma Sooners, the Gators defense held the Sooners to 14 points. During that season the Sooners were averaging 54.0 points per game and had scored a FBS record 702 points. Needless to say, Charlie Strong knows what he is doing on defense.

His tenure as the head football coach at the University of Louisville has been marked by rapid success. In the three seasons before Strong, the Louisville Cardinals were 15-21 with a 5-16 conference record. Over the last four years under Strong’s leadership, the Cardinals have posted a 37-15 record with a 20-9 conference record and a 2012 Sugar Bowl win over the Florida Gators. And not surprisingly during Strong’s tenure the Cardinals have been absolutely stout on defense. From 2010 to 2013 the Cardinals ranked 7th in points per game (18.8), 6th in yards per game (308.1), 10th in yards per play (4.9) and 3rd in sack percentage at 8.3% (1).

Since the early 2000s, the trend in college football and the Big 12 in particular has been for offenses to move towards speed and spread. A consistent theme in Charlie Strong led defenses is to attack the spread with athleticism on defense. An attacking-playmaking defense is something that the current Texas Longhorns haven’t had lately (see the 30-7 Alamo Bowl shellacking they received this past Monday from the Oregon Ducks).

In hiring Charlie Strong, the Texas Longhorns are getting a proven defensive guru. Although past performance is no guarantee of future success at Texas, Charlie Strong’s track record has me convinced that he is the man to turn the Horns around, especially on the defensive side of the ball. If the old adage often rings true, Offense scores points but Defense wins Championships, Strong will be raising a crystal ball during his time in Texas. And at $5.0 million per year, for the next five years the expectation is nothing less.